Debugging an API is essentially no different than debugging any stored procedure. Therefore, a developer can simply put a debug statement in the code. However, this might not be desirable if the web APIs are being accessed by regular users. This article will provide a couple of techniques for debugging and analyzing APIs with minimal impact toward other users.
First Things First
In order to interact with the visual debugger there are a couple of configuration steps that are required.
1. Run the Engine Server in "Debug" Mode
The first step is to make sure you are running the Engine Server from a command prompt (aka "debug" mode). In our Testing for Success article, we provide a sample screen shot of how to launch the Engine Server from a command prompt. It is important to remember that if the Engine Server is also configured to run as a Windows Service then this will need to be stopped in order for the Engine Server in the command prompt to run successfully. Further information can be found in the official 103-966 OpenInsight OEngineServer Configuration.pdf document.
2. Enable the Debugger
The second step is to make sure the engines handling the HTTP request are set to enable the visual Debugger. By default, headless engines will use the Debugger Settings from the Database Manager:
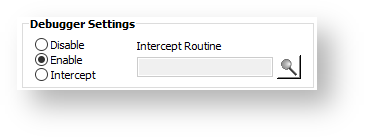
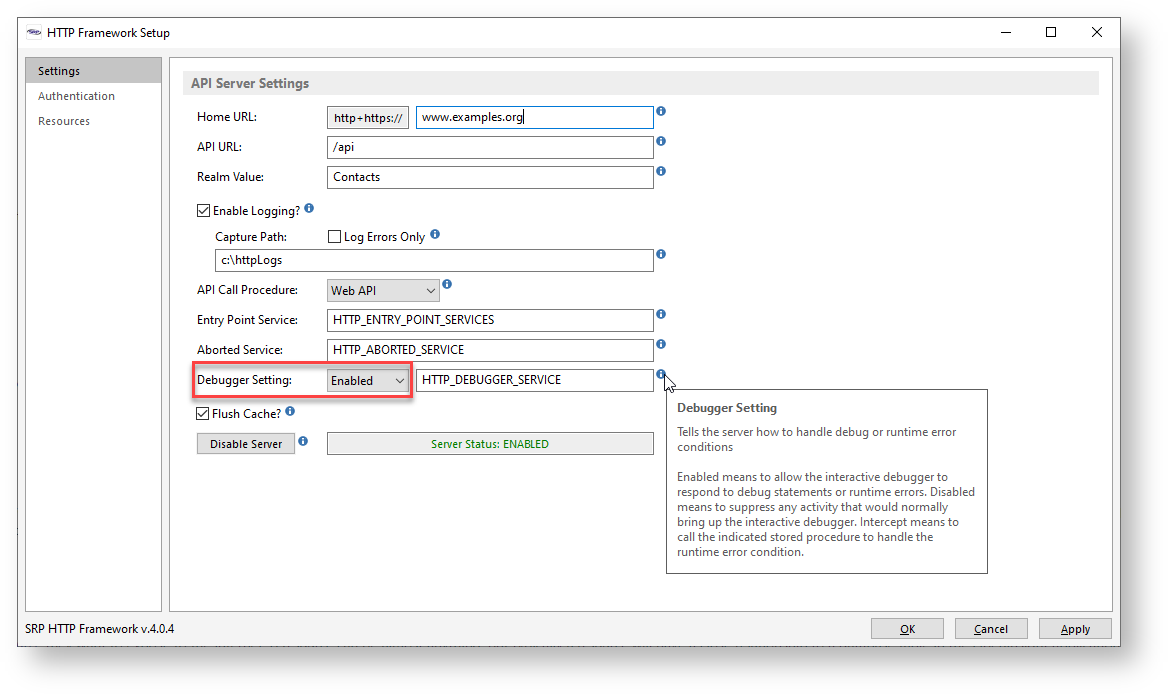
However, there might be times when the production database wants to avoid the Enable setting but the API developer needs to use the visual Debugger. For reasons like this, the HTTP Framework Setup form provides the same options as the Database Manager but this setting will only affect those engines handling HTTP requests:
Triggering the Debugger
The most direct way to debug an API is to debug the code. However, as noted above, simply embedding a debug statement in the API code would interrupt all requests. So there needs to be a way to safely trigger the debugger. In traditional OpenInsight development, developers could check for unique conditions such as the values in the @USERNAME or @STATION system variables. Since all HTTP requests will always be handled by the same username and station, this method isn't useful.
One way to introduce unique conditions is to add custom parameters to the API request. API testing tools like Postman make it very easy to add custom parameters. We recommend updating the AdditionalValues string from the OECGI4 registry key to include HTTP_DEBUG. Doing so will tell the OECGI to pass through a request header with the name Debug. You could, of course, create any name (or names) you want.
The HTTP_MCP controller routine already has code that checks for a value assigned to the Debug request header:
// Engage the debugger if requested.
If HTTP_Services('GetRequestHeaderField', 'Debug') then Debug
This same code could be copied anywhere and adapted as needed (e.g., change the name of the header field or check for a specific field value). APIs can now be easily debugged without impacting regular API calls.
Examining the Log Files
While not the same as using the Debugger in an interactive manner, the log files can provide an abundance of useful information. For instance, the entire OECGI request array is maintained in each Request log. This is structured so it is easy to review (read: delimiters are replaced with human readable formatting). The entire response (with some useful metadata) is maintained in each Response log. Furthermore, depending upon how your Debugger Setting is configured, runtime errors will appear in a Debugger, Aborted, or GetStatus log. If you already know some details about a specific request that you need to investigate (e.g., status code, date/time range, endpoint, etc.) you can quickly find the relevant logs using the HTTP Logs utility (just launch the NDW_HTTP_LOGS form):
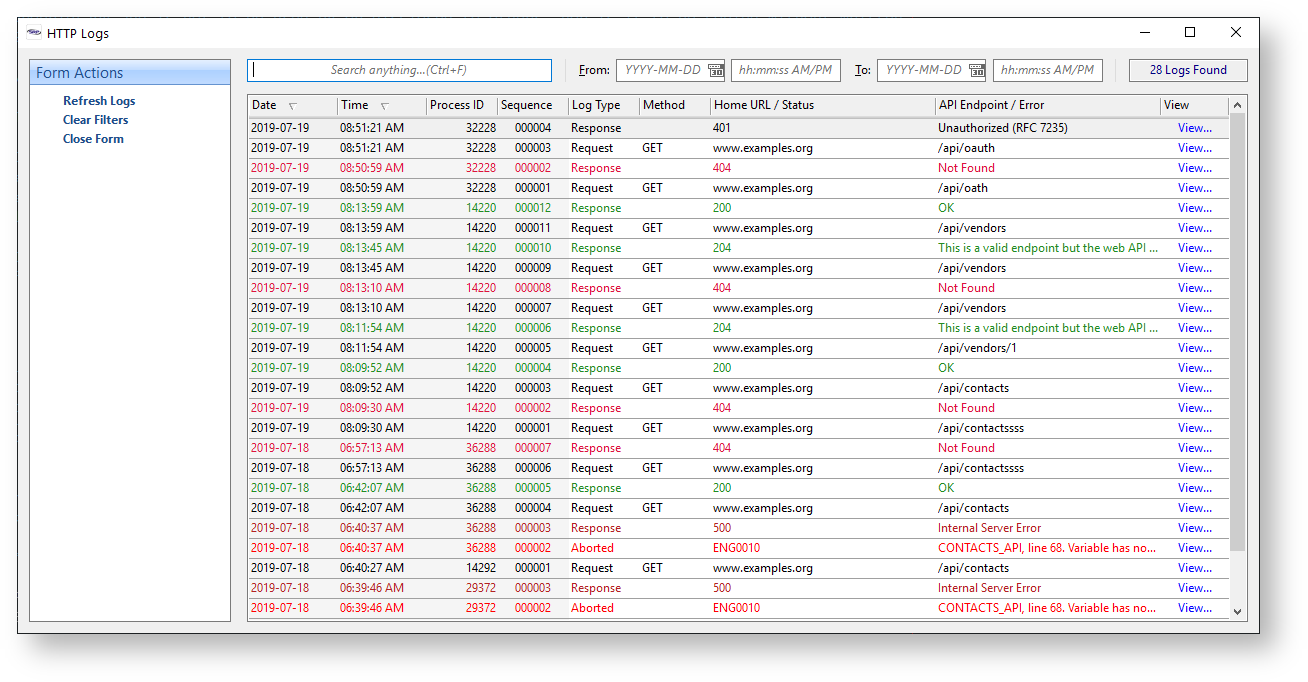
Careful study of the logs files can often avoid the need to debug code. In the above screen shot, sample runtime errors can be seen in the Aborted log types. Unexpected conditions that are not due to runtime errors (like 4xx responses) can also be easily inspected with the relevant logs.