Debugging an API is essentially no different than debugging any stored procedure. Therefore, a developer can simply put a debug statement in the code. However, this might not be desirable if the web APIs are being accessed by regular users. This article will provide some ideas for debugging APIs with minimal impact toward other users.
First Things First
In order to interact with the visual debugger there are a couple of configuration steps that are required.
Run the Engine Server in "Debug" Mode
The first is to make sure you are running the Engine Server from a command prompt (aka "debug" mode). In our Testing for Success article, we provide a sample screen shot of how to launch the Engine Server from a command prompt. It is important to remember that if the Engine Server is also configured to run as a Windows Service then this will need to be stopped in order for the Engine Server in the command prompt to run successfully. Further information can be found in the official 103-966 OpenInsight OEngineServer Configuration.pdf document.
Enable the Debugger
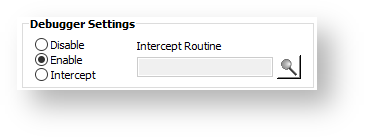
The second configuration item is to make sure the engines handling the HTTP request are set to enable the visual Debugger. By default, headless engines will use the Debugger Settings from the Database Manager:
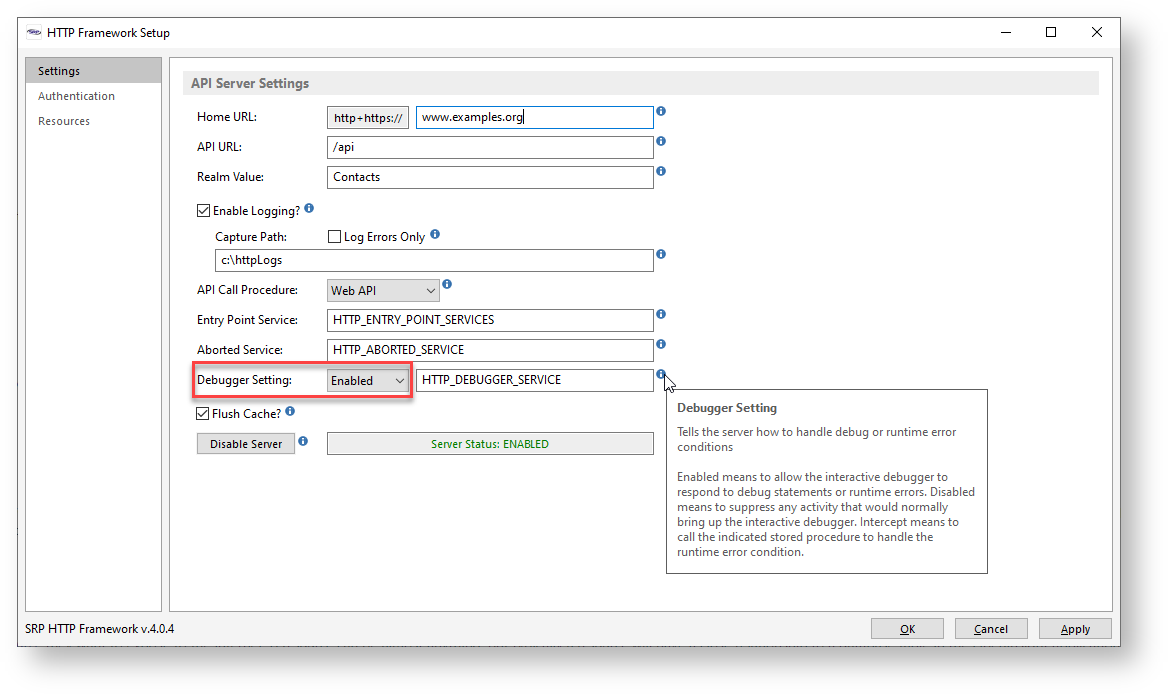
However, there might be times when the production database wants to avoid the Enable setting but the API developer needs to use the visual Debugger. For reasons like this, the HTTP Framework Setup form provides the same options as the Database Manager but this setting will only affect those engines handling HTTP requests: